May 30, 2019
Library Design: How Many Seats Do We Need?
By Elliot Felix of brightspot strategy and Martha Kyrillidou of Quality Metrics
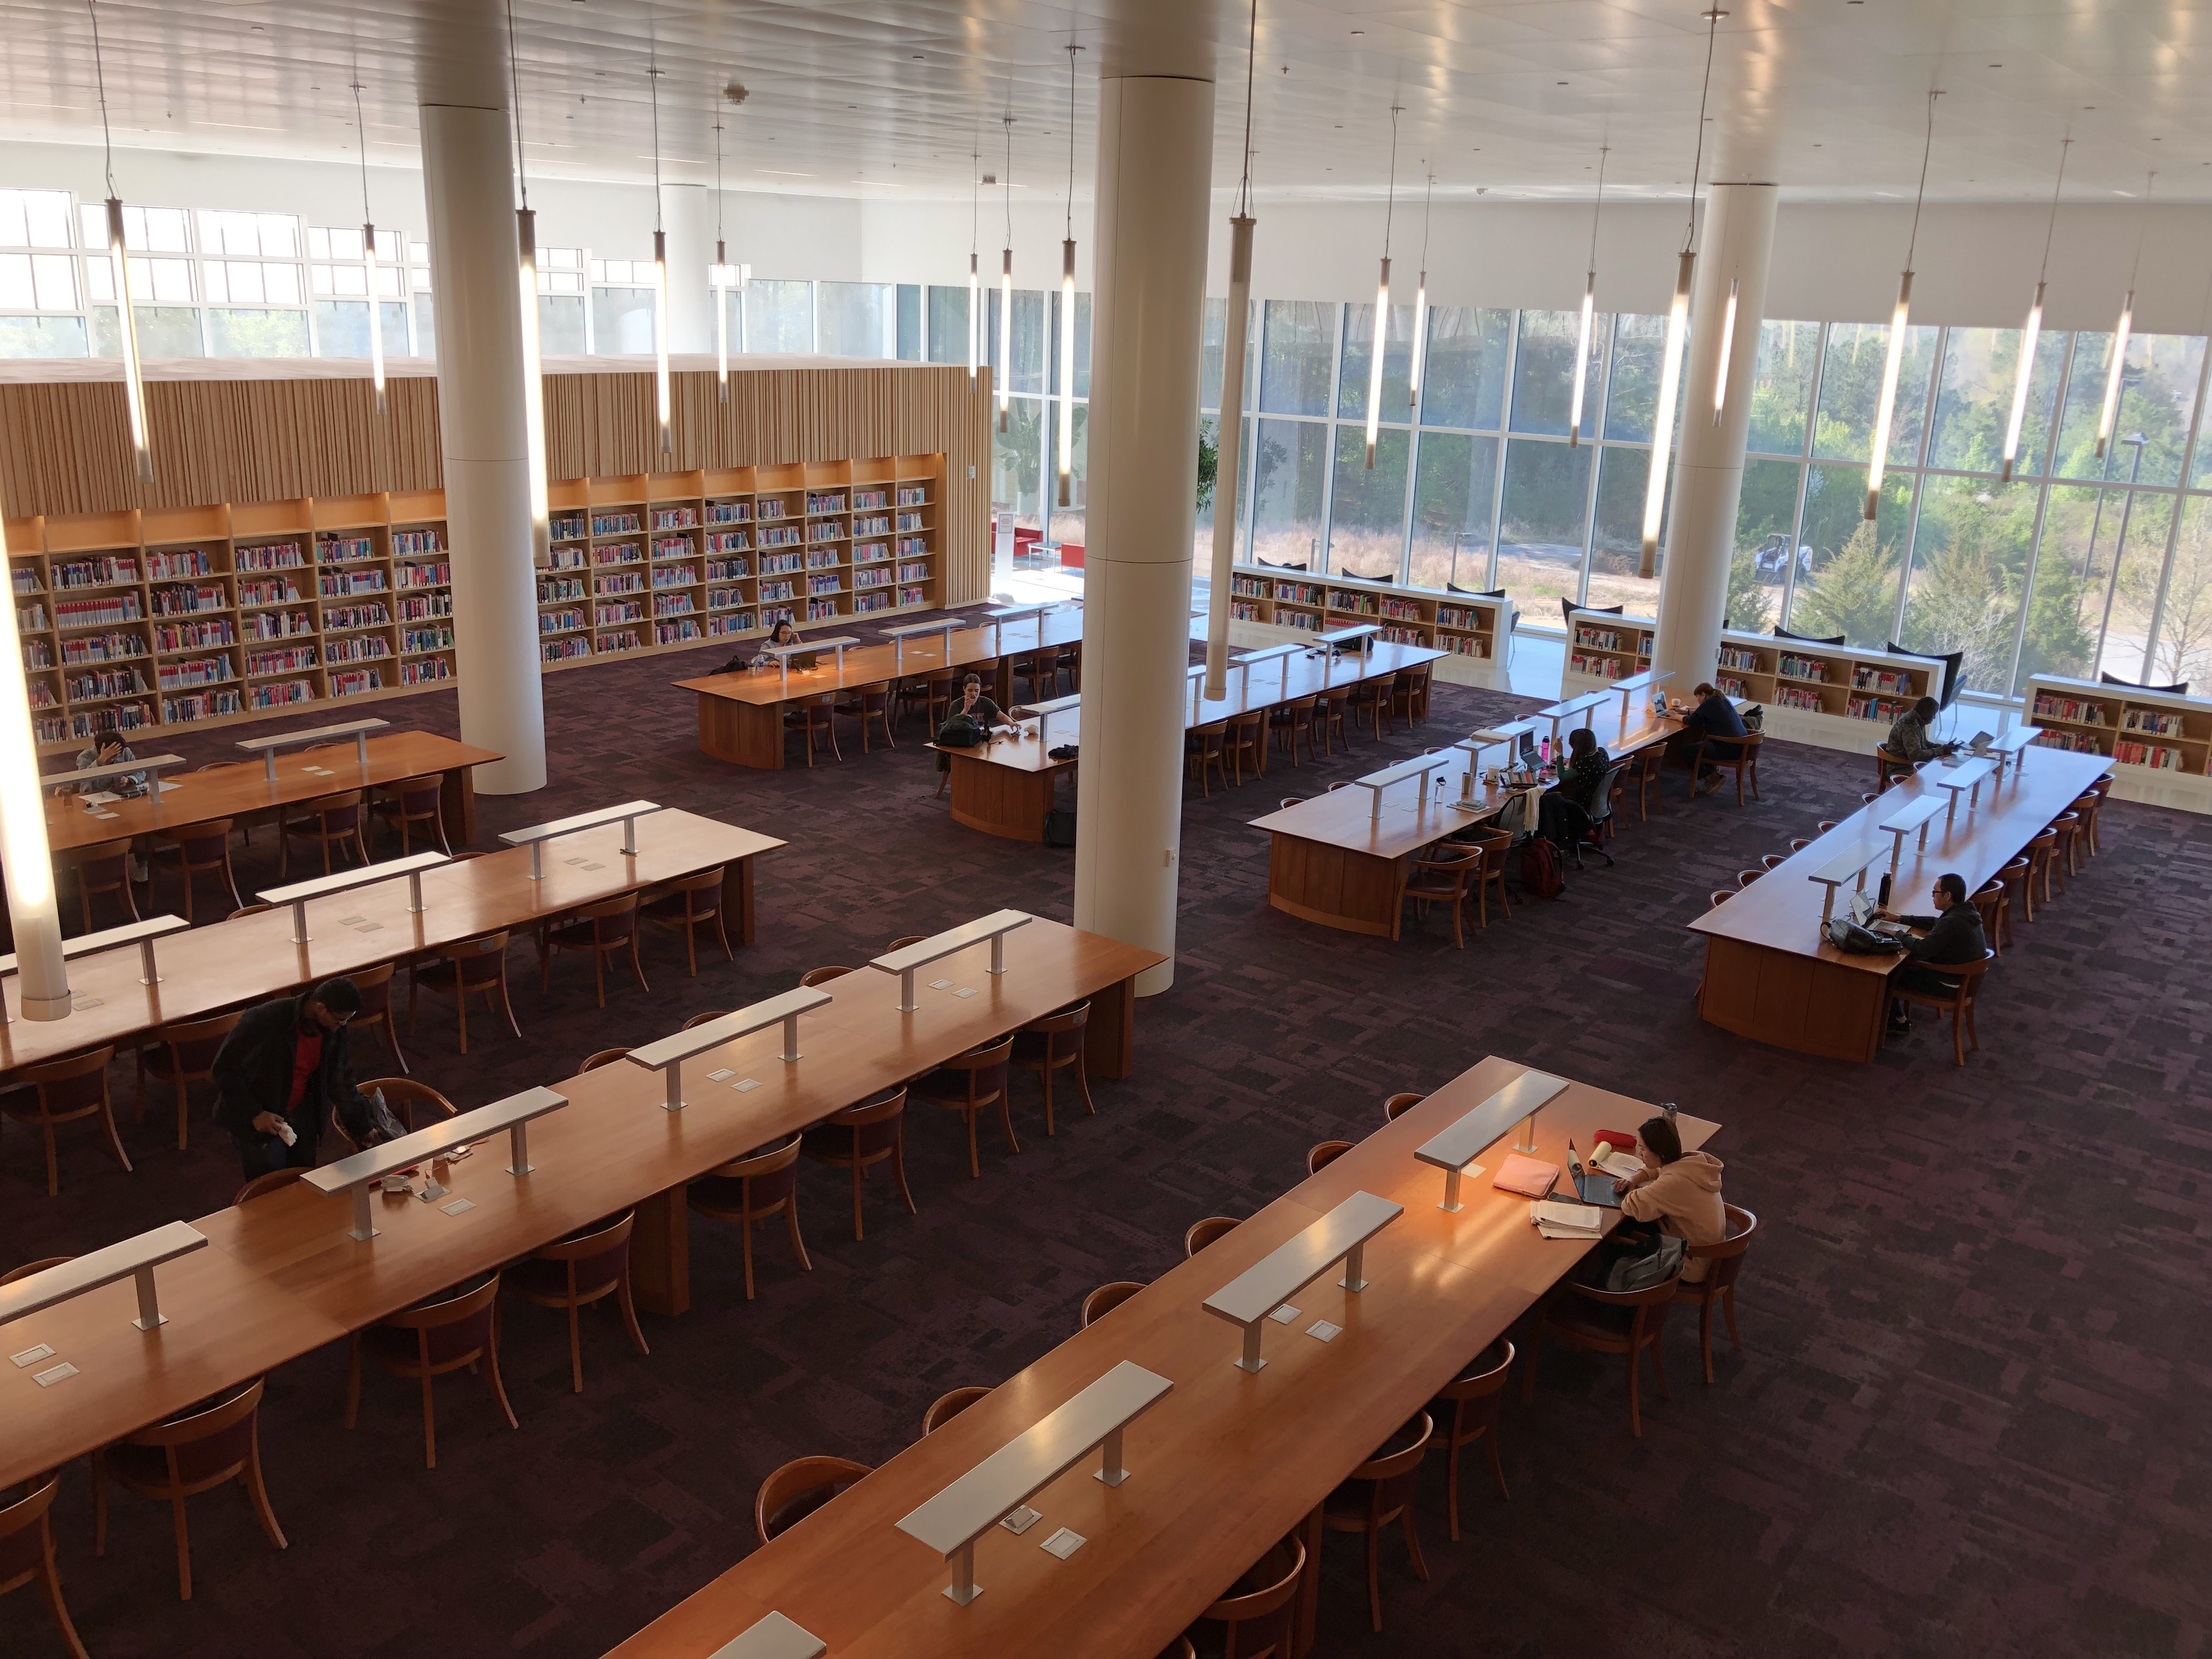
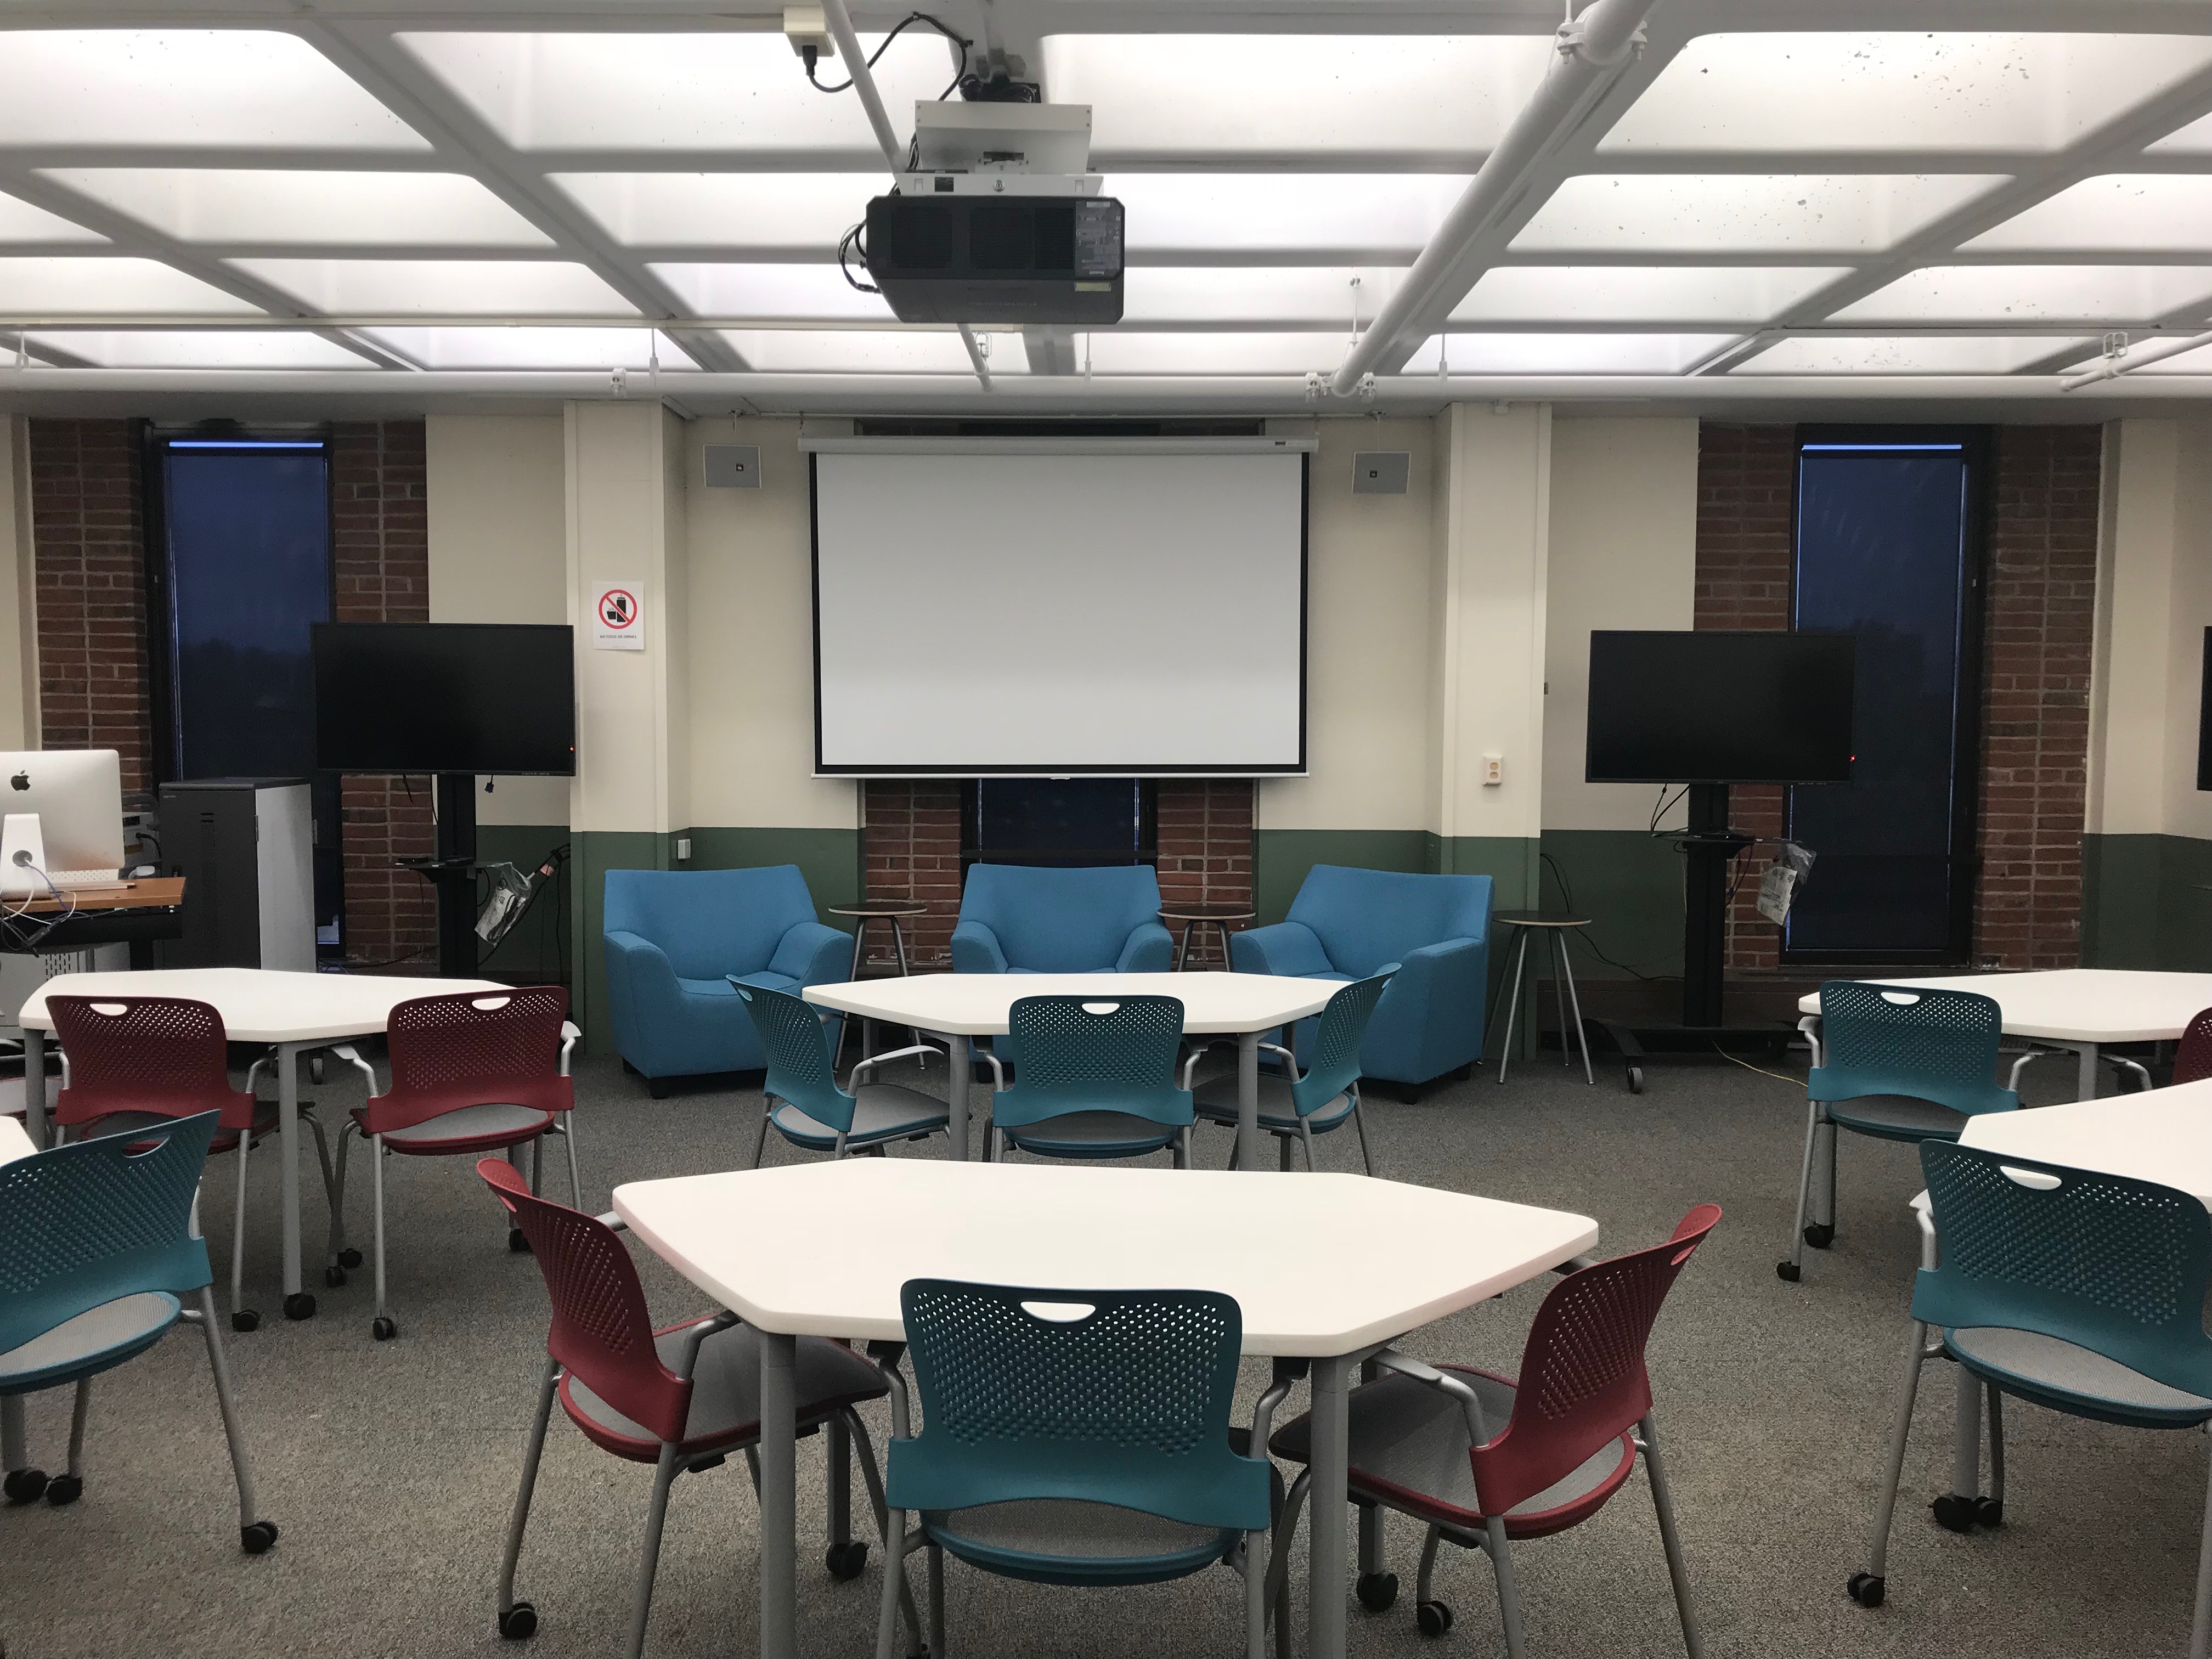
What’s the one question that comes up on nearly every library design project: How many seats do we need in our library? Libraries have evolved from solely places to access information into places to also connect, create, and collaborate. The balance of their space has shifted from primarily housing books to also providing ample seating for other programming. The balance shifts further as libraries incorporate fun learning activities, active learning classrooms, and academic services partners that transform into student success hubs. It shifts further still with the provision of distributed study space around campus in lobbies, lounges, and project spaces. Libraries are no longer the only game in town!
In this post we’ll outline a new methodology for ballparking the number of seats libraries should provide.
By creating two new metrics of annual visits per student and annual visits per seat, institutions can use peer benchmarking data to create a weighted forecast that accounts for the utilization of seats.
(This is based on and further elaborates on a presentation at the 2018 Association of Research Libraries (ARL) Library Assessment Conference by me and Martha Kyrillidou of QualityMetrics.)
A Tough Library Design Question: “How Many Seats?”
As complex as these library transformations are, they still leave libraries with a simple question: how many seats do we need in our library? As the purpose and use of libraries have evolved, answering this question became more complicated: standards have been rescinded, heuristics became outdated, and institutions are left with no good answer. For example:
- The Association of College and Research Libraries (ACRL) 1995 standard to accommodate seating for 25% of the student population has been rescinded.
- The Association for Learning Environments (A4LE) 2006 standard of seating for 12% of undergraduates, 30% of graduate students, and 5% of faculty is outdated.
- Benchmarking data from peers is often limited, inconsistent, and outdated; for instance, ARL collected space data only in 2012 and different institutions count seats differently (For example, are general classroom seats included?).
- When available, peer data do not account for utilization or seat quality such as the net square feet per seat or the proportion of seats at large tables that are unlikely to be used except for extreme peak periods when norms against sitting with strangers take a back seat.
Evolving to accommodate an expanded purpose and adapting to new uses despite a lack of planning standards is hard enough. But, the rise of fully-online education and programs that blend online and on-campus interaction further complicate the library design question of “how many seats?”
What are Institutions Doing to Know How Many Seats to Provide?
Faced with this challenge, some institutions simply try to maximize their seating by carefully reducing the space allocated to collections and increasing the space allocated for people, hoping that demand will equal supply. Others target a percentage of their population in a throw-back to previous standards or based on a peer average, without taking into account the actual usage of their spaces. Others have no plan at all.
During the 2018 ARL Library Assessment Conference, we polled attendees on this question: “What is the best method to calculate the number of seats in your library?” Of the 63 responses, 67% said “Collect evidence on how space is utilized,” 8% each said “Target a % of students” and “Just provide as many seats as you can”, and 10% had other ideas. This indicated a desire to drive forecasts from real utilization data. The most coarse of these data is a library’s gate count – the number of annual visits to the space – but this count can be heavily skewed from one library to the next; for instance, if the library contains a large number of general classrooms or if the library is a passage between other buildings with people passing through but not necessarily entering it.
What’s a Better Way to Answer the Seating Question?
So, how can institutions more simply, reliably, and accurately ballpark the amount of user seating they need? By coupling peer analysis of library utilization with their student population so that their forecast is determined not simply by population but by the predicted usage of space as well.
Using ARL data on gate count and population, we have developed a new methodology that uses the key metrics of “visit per seat” and “visit per student” in order to determine future seat needs.
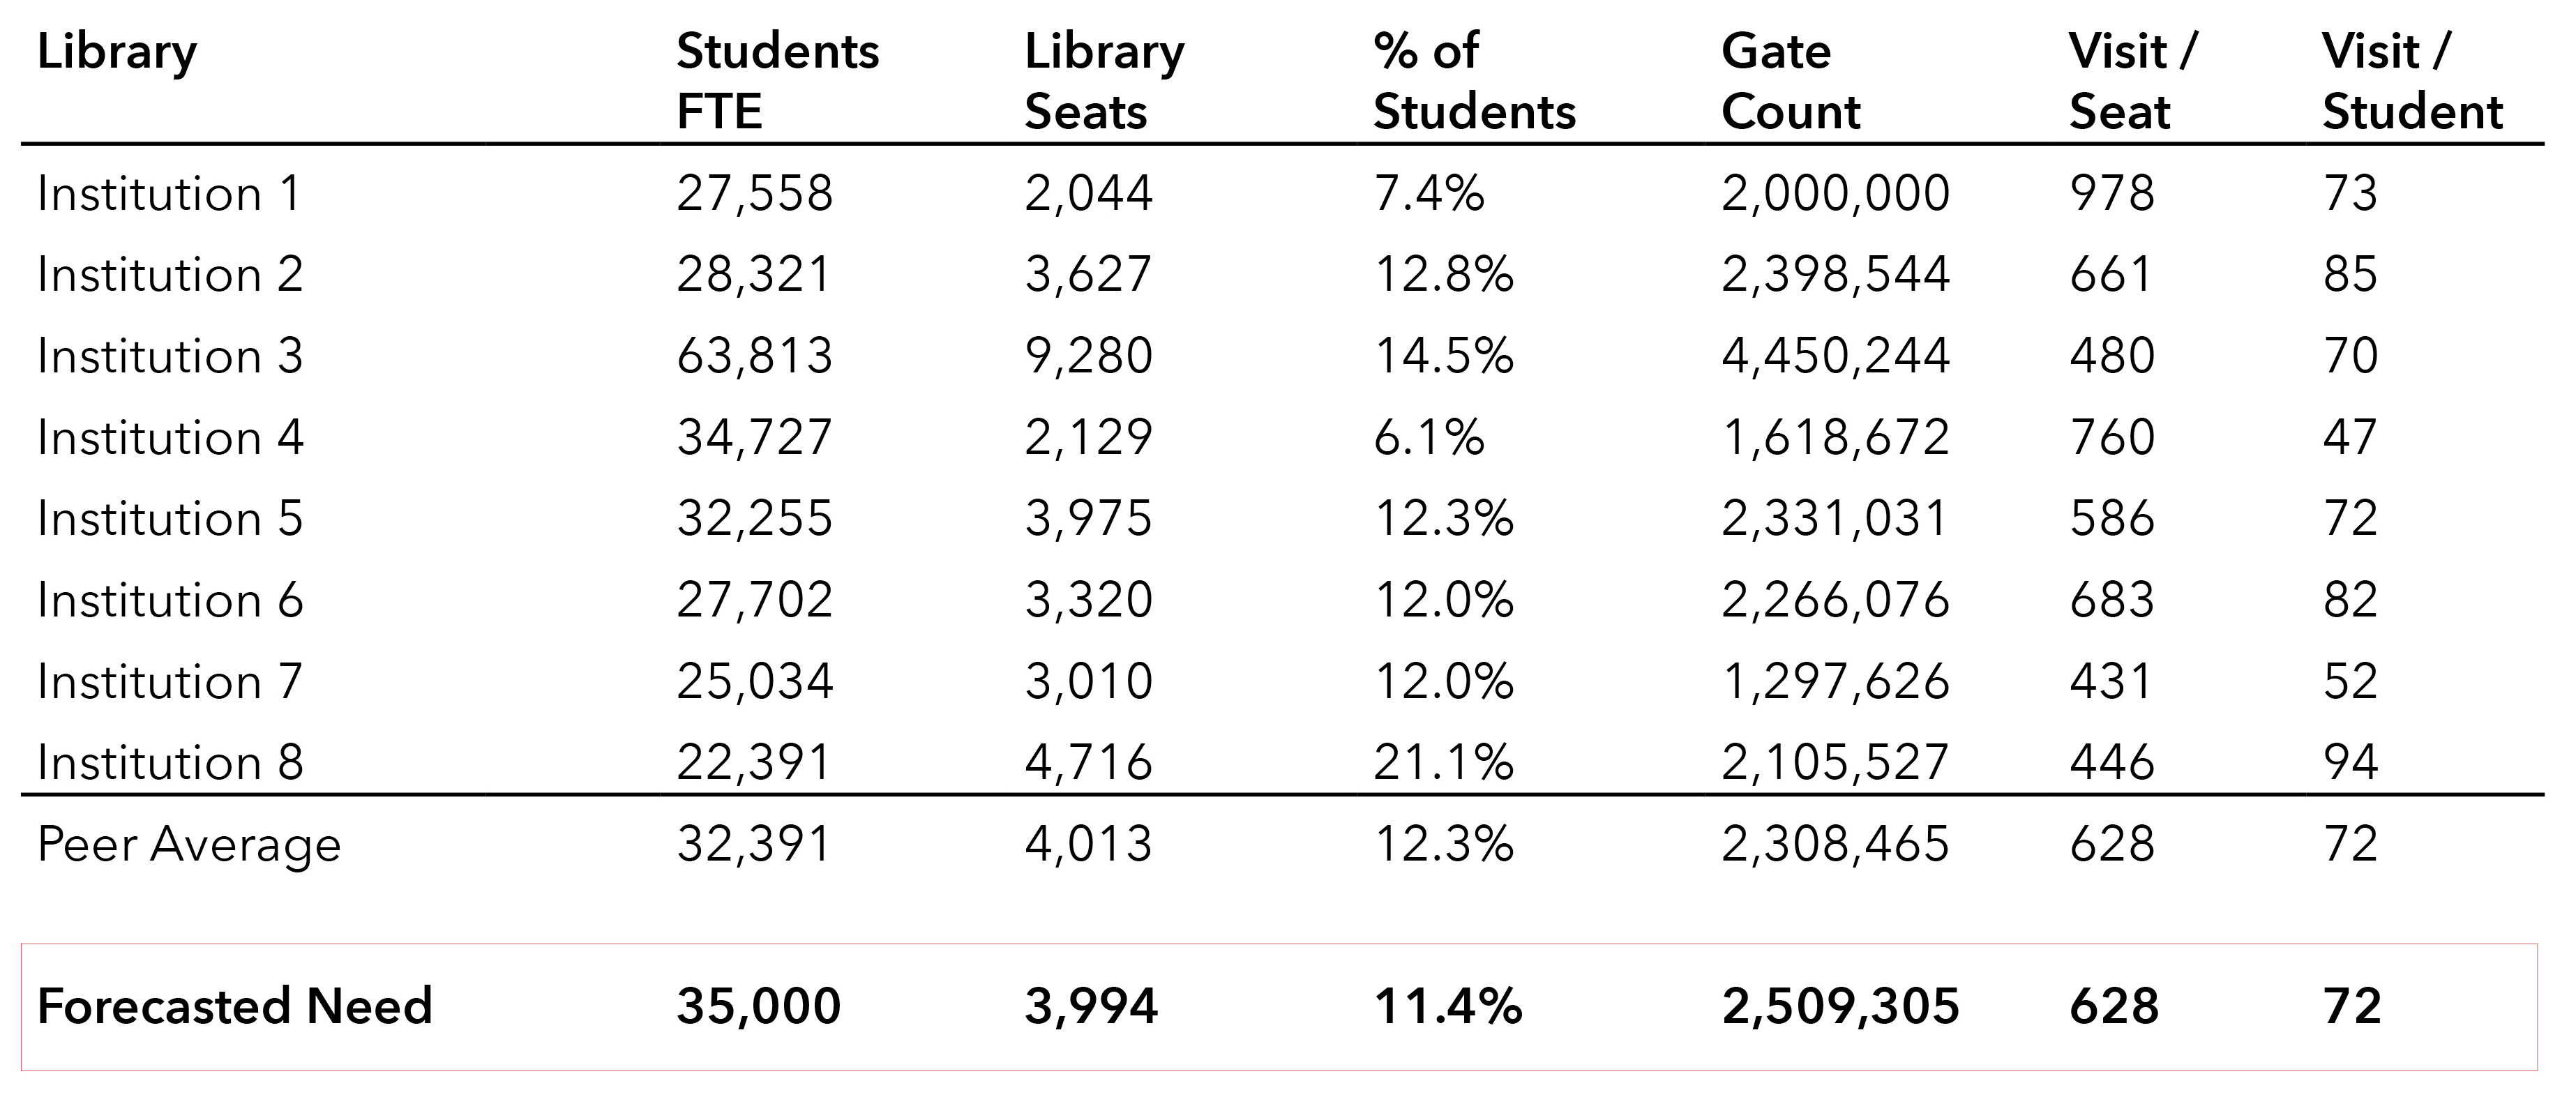
- By taking a future student population and dividing by the peer average of “visits per student,” an institution can forecast their future gate count (being selective to use peers who’ve recently renovated and thus have a gate count that’s more indicative of the future state).
- By taking this future projected gate count and dividing it by the peer average of “visits per seat” institutions can then determine the future number of seats needed (and understand this as a percentage of their student population).
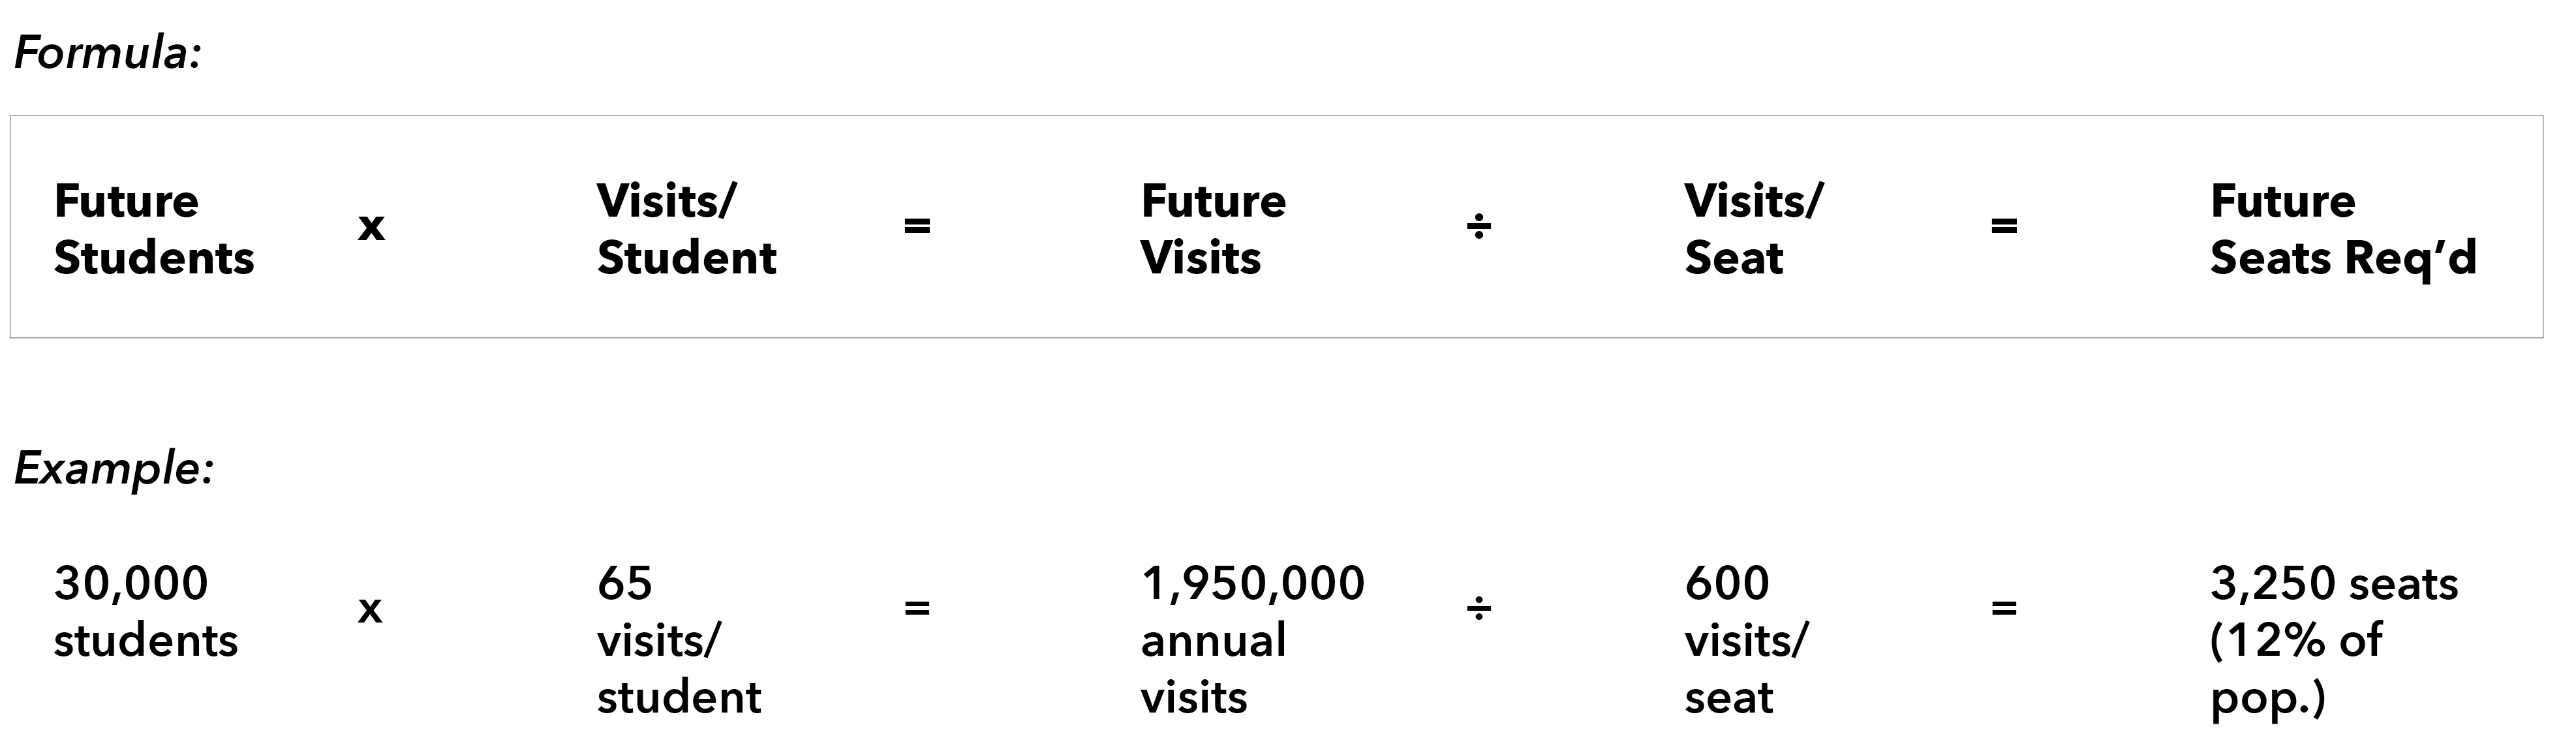
For example, imagine a growing campus looking to forecast the seats they’ll need in their libraries to accommodate 30,000 students in the future. First, select a group of relevant peer and aspirant institutions and calculate their average visits per student. An average of 65 visits/student would then predict 1.95M annual visits and then dividing that by a peer average of 600 annual visits per seat yields an estimated seat count of 3,250 seats.
What Data Are Available and What Do They Tell Us?
To begin incorporating utilization data into future forecasts, we used the ARL 2012 survey of library seating and added student population at full-time equivalents (FTE) using data from the Integrated Postsecondary Education Data System (IPEDS) from the U.S. Department of Education.
Of the ARL member libraries, 94 provided seat count and gate count data. We then added operating hours for these libraries that we gathered from their respective websites. To account for the impact of classroom seats (which were separately indicated in the ARL data), we prorated these seats by the assumed hours per week they’d be available for library use when not in use for scheduled classes the other 45 hours per week; for instance, if the library was open all 168 hours in a week, a classroom seat would count as 0.73 seats (168-45=123/168=0.73).
From this analysis, we concluded:
- There is no correlation (r = 0.04) between how many hours per week a library is open and how heavily it is used (in visits per seat).
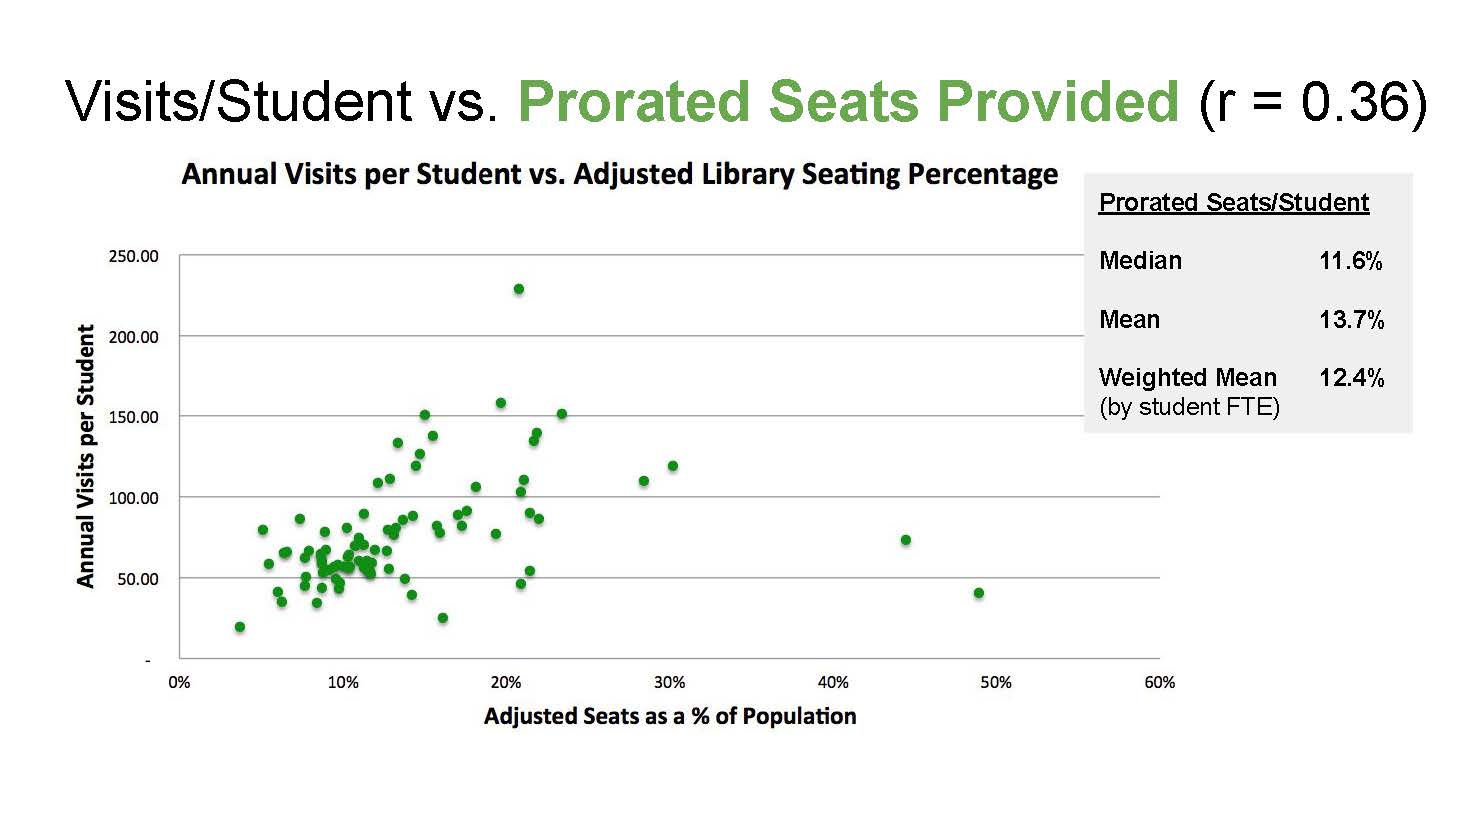
- There is a weak correlation (r = 0.36) between how many seats are provided in the library and how heavily the library is used (in visits per seat).
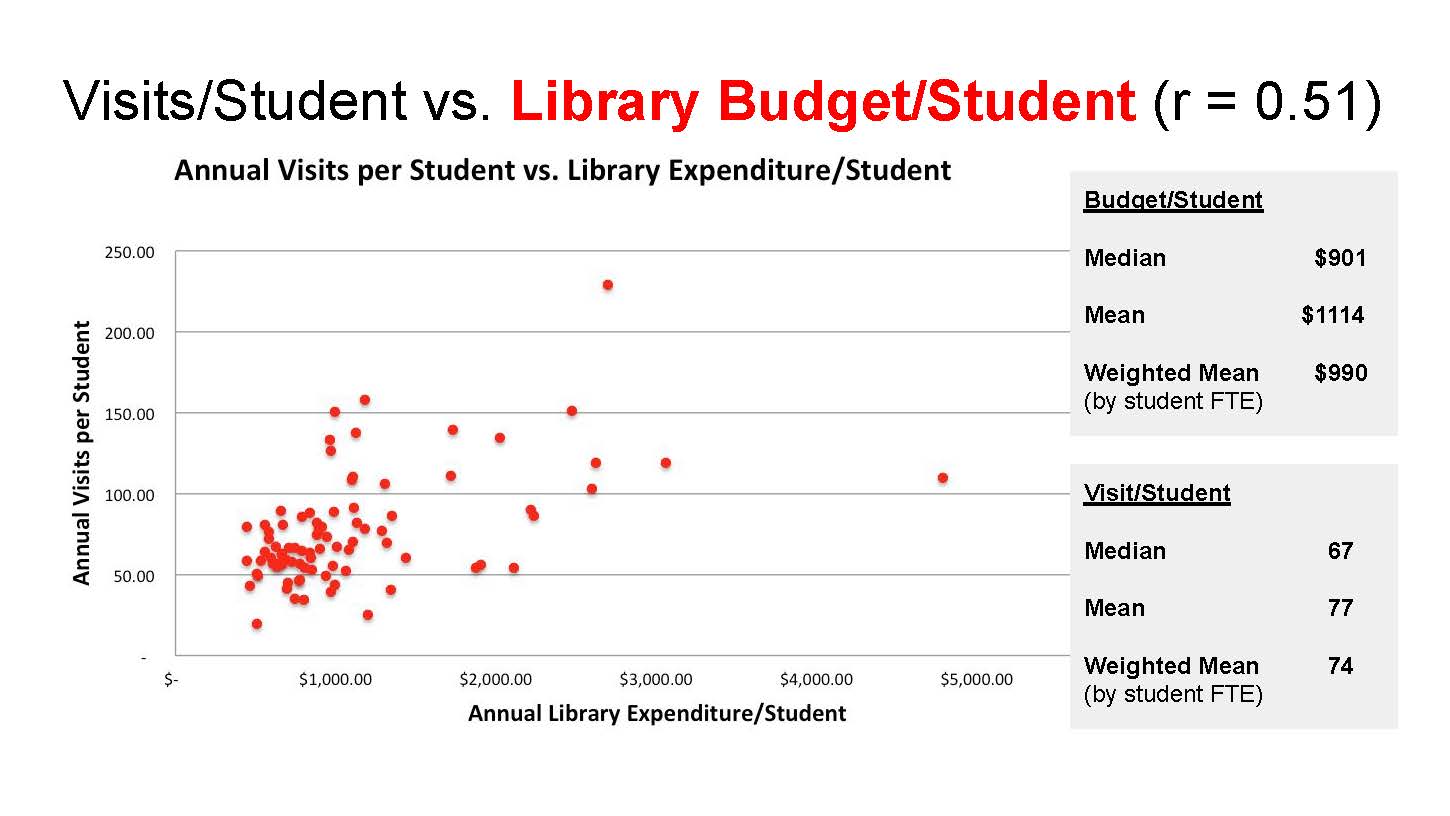
- There is a moderate correlation (r = 0.51) between a library’s annual budget per student (in dollars) and how heavily the library is used (in visits per seat).

There are clearly many more factors one would need to consider, especially as the investment dollars relate to the utilization of the space. Are better-funded libraries providing better spaces with more comfort and a larger variety of spaces allowing for comfort, food, and other creative activities in a multiplicity of ways? Is there a positive feedback loop in these environments where more emphasis is placed on the library student experience? Are services more responsive to student needs, more flexible to accommodate different levels of need, and are staff empowered and encouraged to use policies for the benefit of the users rather than adhering to them with rigidity? Are their basic fundamental custodial services better funded so bathrooms are always clean, food behaviors better managed, and cleanliness fully served during all working hours?
What Might the Impact of Online Learning Be?
The rise of fully-online education and programs that blend online and on-campus interaction further complicate the question of “how many seats?” beyond the challenge of outdated planning standards and piecemeal planning data. The latest report from the National Center for Education Statistics shows online education growing at about 6% a year, with 15% students fully-online, 18% combining online and on-campus course, and 33% of students taking at least one course online. So, it’s tempting to think this will decrease the need for library seating. Not so fast. At least in the foreseeable future, online learning will not diminish the need for library space. This is for two core reasons:
- Even fully-online programs are finding the need for people to meet in physical spaces. For instance, both for-profit and non-profit institutions are creating “micro-campuses” for students to meet, get services, and even attend a class. The online education company 2U created a partnership with WeWork for students to collaborate in their flexible office spaces. This all makes sense given that much of online education remains local: Babson’s Survey Research Group found that in 2016, about 56% of students who took only online courses lived in the same state as their institution and among students at public universities, this is 84%.
- The shift to learning that blends face-to-face with online interaction will drive more traffic to libraries. For online, one example of this blended learning paradigm is the “flipped classroom” in which students watch recorded lectures then work on projects together during class guided by their instructors. These students tend to watch the lectures in small groups while pausing, rewinding, and discussing as they go. These students also need places to work on their class projects. Libraries are well-suited to support these projects with flexible, bookable spaces; tools and technology; and staff support.
It’s also worth noting that online learning often adds other types of library spaces beyond user seating. For instance, on most campus there is a “Center for Teaching and Learning” or a “Center for Excellence in Teaching and Learning” that offers services to faculty and graduate student instructors such as instructional design, media production, and instructional technology support. These are often best located in the library as a mission-aligned partner and central campus resource, and require spaces for staff to work in, places for them to consult with faculty, places to create videos and graphics, and places for events that showcase work and enable faculty to inform and inspire each other.
Using Seating Forecasts for Better Library Design
Institutions can begin creating utilization-based seating forecasts right away using our analysis of the ARL dataset of 94 libraries with seat count and gate count data. However, while this is a starting point and has limitations because of the number of institutions in the dataset and the fact that it dates back to 2012, we imagine that the academic library community can move forward on two parallel paths:
- Libraries can submit their campus-wide seating data to a public, open-access Google sheet that we have set up here: http://bit.ly/LibSEAT. This sheet will provide a dataset that can work for a broader set of institutions and rely upon more updated data. This sheet will have a network effect: the more people that contribute to it, the more useful it will become. Ultimately, this sheet could also become more granular, for instance, we could create a column for each library on a campus rather than using a coarse, campus-wide total.
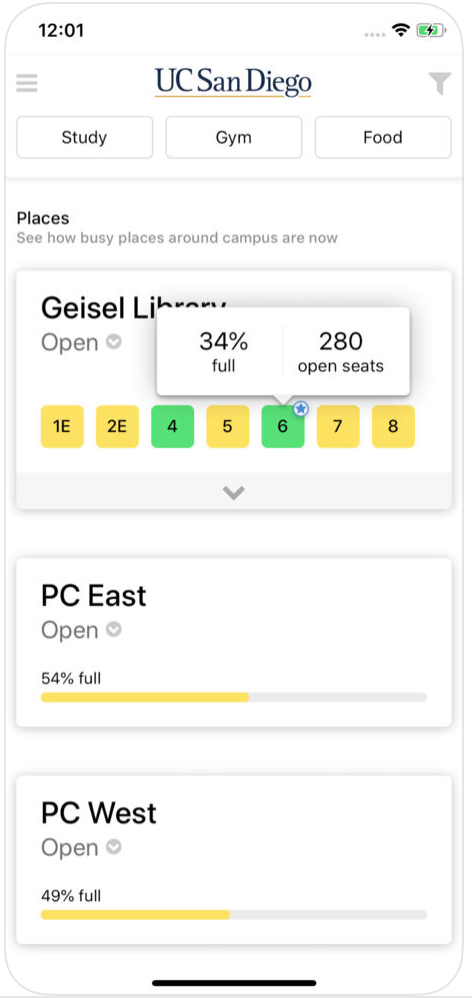
- Libraries can gather more granular utilization data to inform forecasts in a more accurate and detailed way than annual gate counts can. There are a number of promising technologies out there for measuring utilization. The SUMA tablet app developed by NC State provides a free and simple way for a human observer to count occupants and activities in a semi-automated way. The Vantage Space app allows users to pay a small fee, upload their floor plans, and then use a tablet app to have human observers touch spots on the plans to count occupancy at regular intervals, with the app automatically generating tables, graphs, and heat maps. Perhaps most promising, Occuspace has developed an app, piloted at UC San Diego called “Waitz” that tracks space use in real-time and publishes these data in online dashboards that students can use to plan their visits and the institution can use to plan and operate their spaces.
Good luck as you move ahead! We encourage you to forecast your future seating, to share your data in our public Google Sheet to contribute to build this open access planning resource, and to test out some of the emerging utilization tools for yourself. Get in touch if you have questions or need advice!